
Across the country, students of color are disproportionately excluded from ever receiving a college diploma due to several barriers impacting access, retention, and college completion. State flagship universities, in particular, have struggled to allocate sufficient resources and pass equitable policies to help. You can read more about what the reason framework is about here.
University of Illinois at Urbana-Champaign
For much of its history, racial equity has been stubbornly elusive for the University of Illinois at Urbana-Champaign. Today, less than 6% of UIUC students identify as African-American despite comprising about 15% of the state’s residents. Not only has UIUC failed to enroll a student body that reflects the racial and socioeconomic demographics of the state of Illinois, but on broader measures of racial equity — attracting and retaining a diverse faculty, investing resources to support and retain students of color, social inclusion, among others — too often the university has not lived up to its promise, nor has it been held accountable. This tool helps paint a picture about the status of racial equity at UIUC and will better position the Illinois REASON Coalition and our communities to advocate for change. Learn more about the REASON Project here.
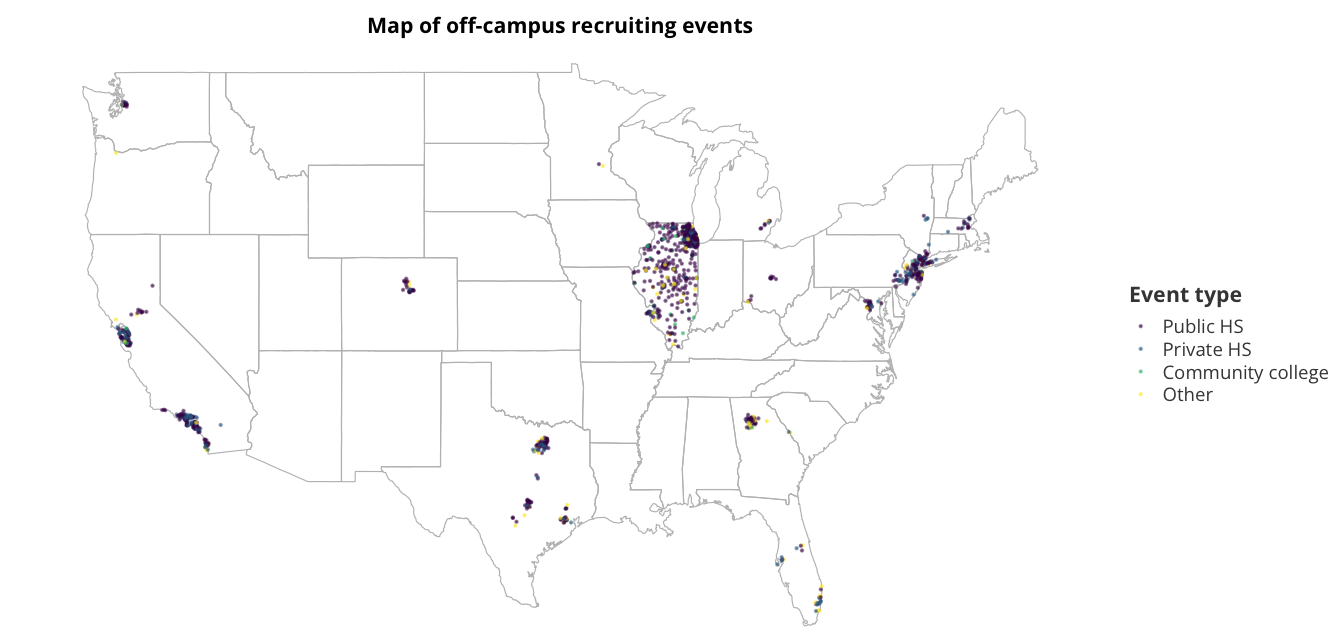
In 2019, the University of Illinois at Urbana-Champaign primarily recruited in Illinois, as well as California, Washington, Colorado, Texas, Florida, Georgia, Minnesota, Michigan, Indiana, Ohio, and along the northern East Coast. A majority of the in-state visits were to public high schools, while private high school visits were more common out-of-state.
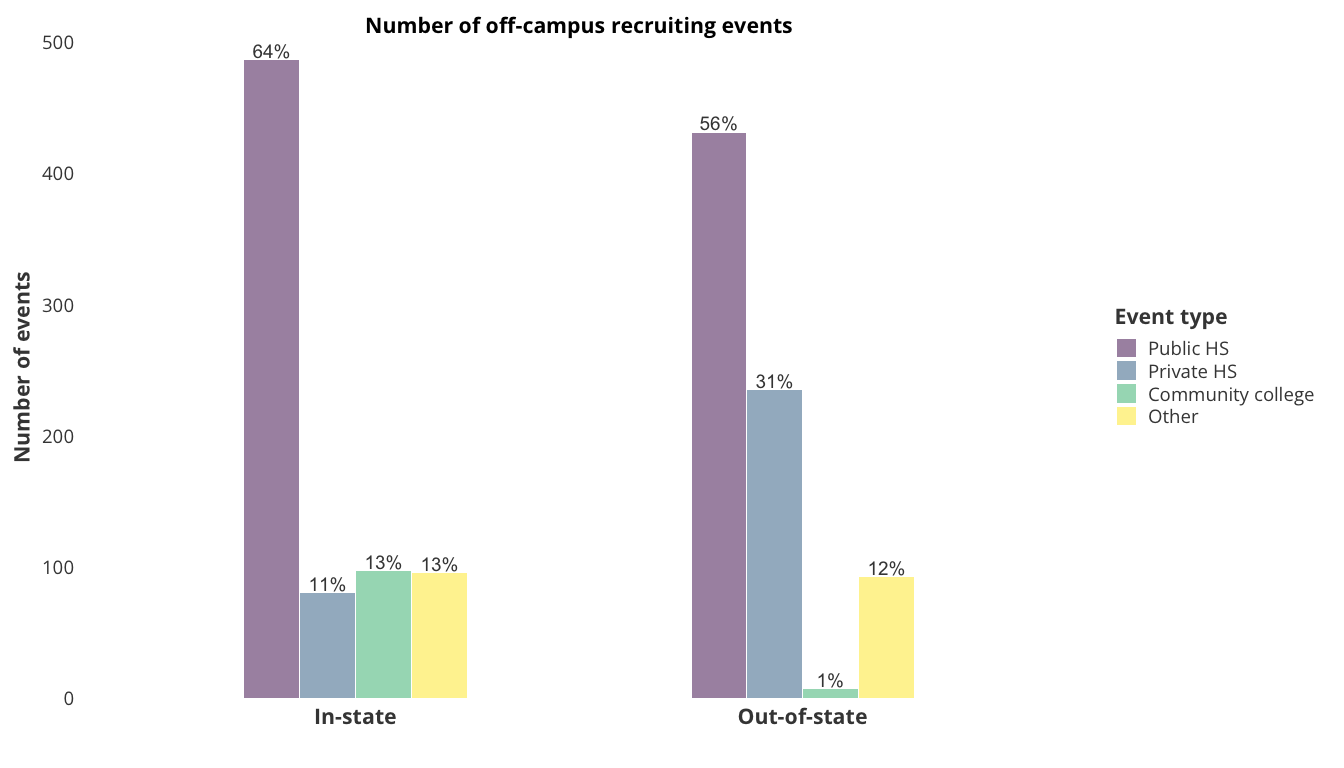
Public high school visits made up the majority of both in-state and out-of-state recruiting, at 64% and 56% respectively. Private high school visits also made up a significant proportion of out-of-state events at 31%, compared to 11% for in-state. On the other hand, in-state recruiting consisted of more community college visits.
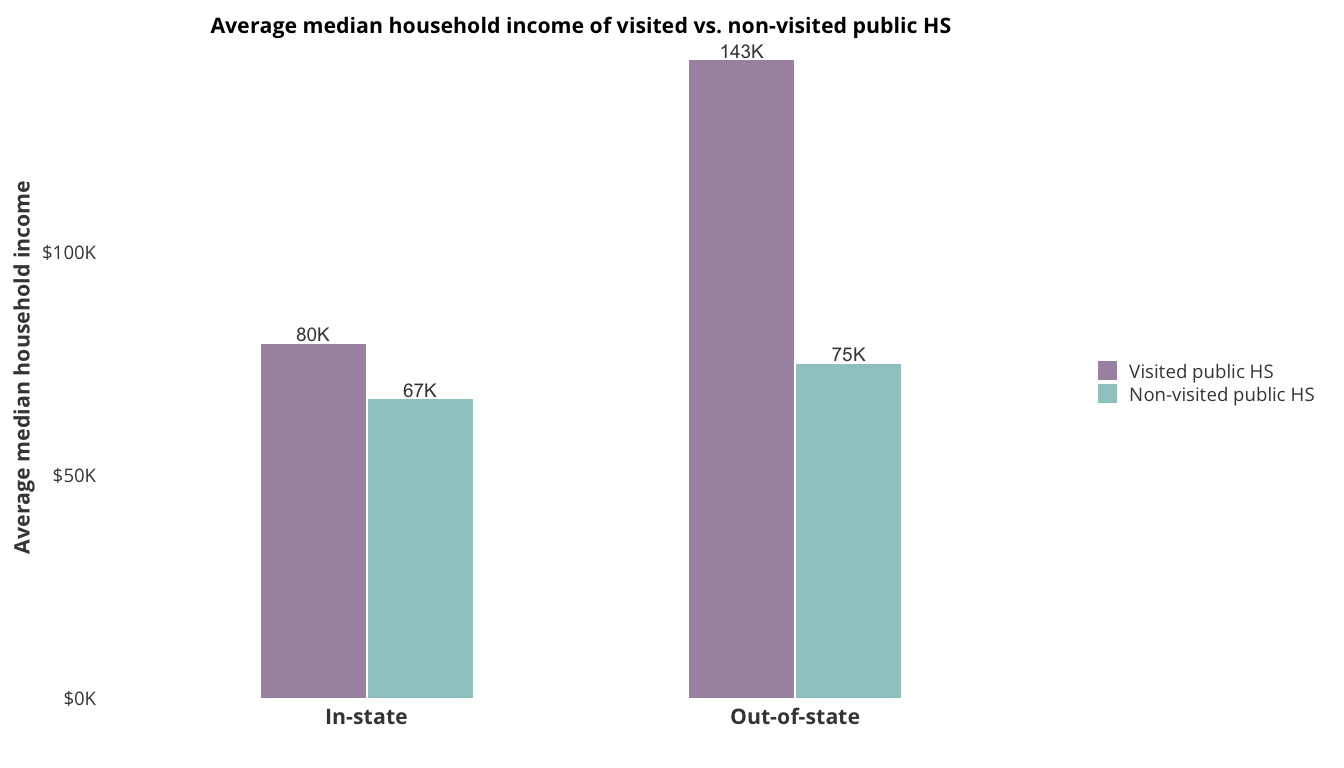
Public high schools that received a visit were in zip codes with higher median house income, on average, than schools that did not receive a visit. In the state of Illinois, visited public high schools were located in zip codes with an average median household income of $80,000, as compared to $67,000 for non-visited schools. The income disparity is even greater for out-of-state recruiting, where the average median income was $143,000 for visited public schools compared to $75,000 for non-visited schools.
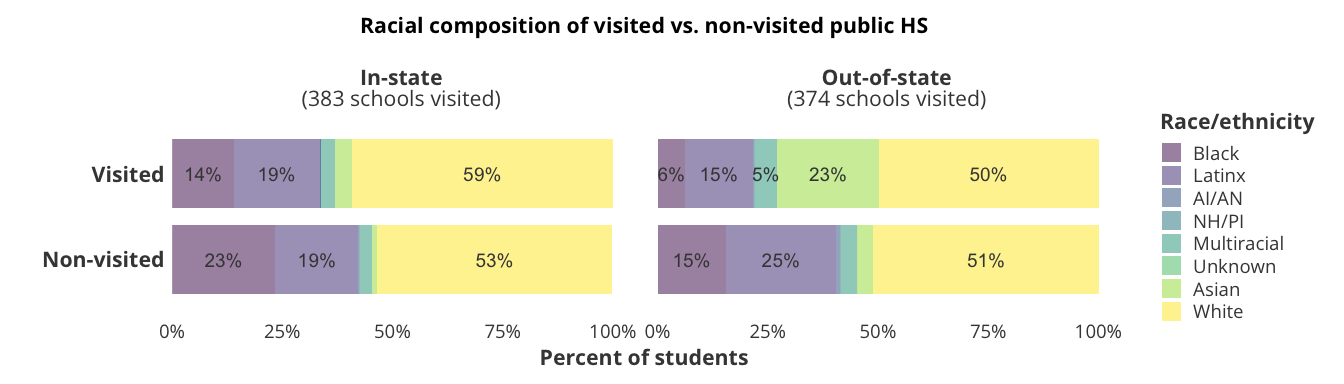
Public high schools visited by the University of Illinois at Urbana-Champaign tend to have a lower proportion of Black students than schools not visited by the university. In the state of Illinois, visited schools enroll an average of 14% Black students compared to 23% for non-visited schools. The same trend is observed for their out-of-state recruiting, where visited schools enroll an average of 6% Black students compared to 15% for non-visited schools. Latinx students are also visited proportionally less out-of-state, while Asian students are visited more, as compared to their non-visited counterparts.
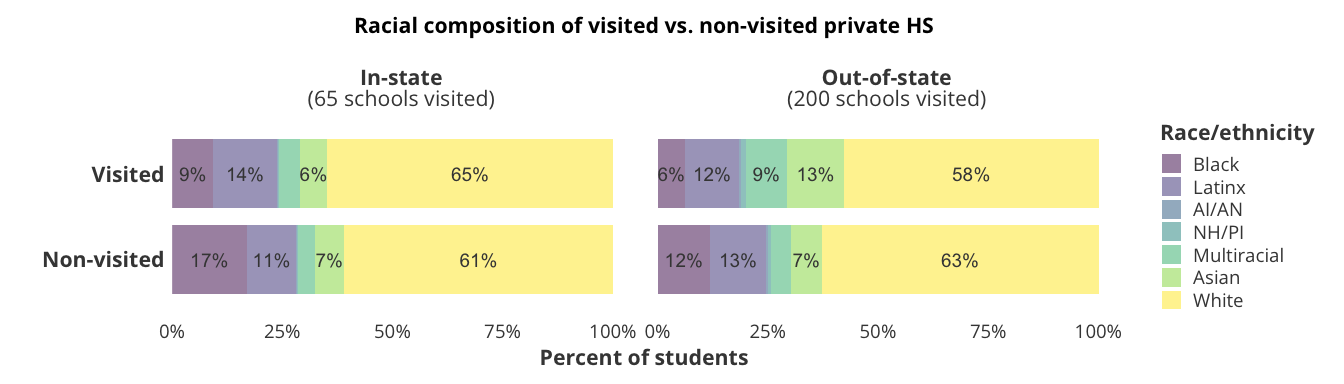
Private high schools visited by the University of Illinois at Urbana-Champaign also tend to have a lower proportion of Black students than schools not visited by the university. In the state of Illinois, visited schools enroll an average of 9% Black students compared to 17% for non-visited schools. Similarly, visited out-of-state schools enroll an average of 6% Black students compared to 12% for non-visited schools. The proportion of other racial/ethnic groups are comparable for visited versus non-visited schools.
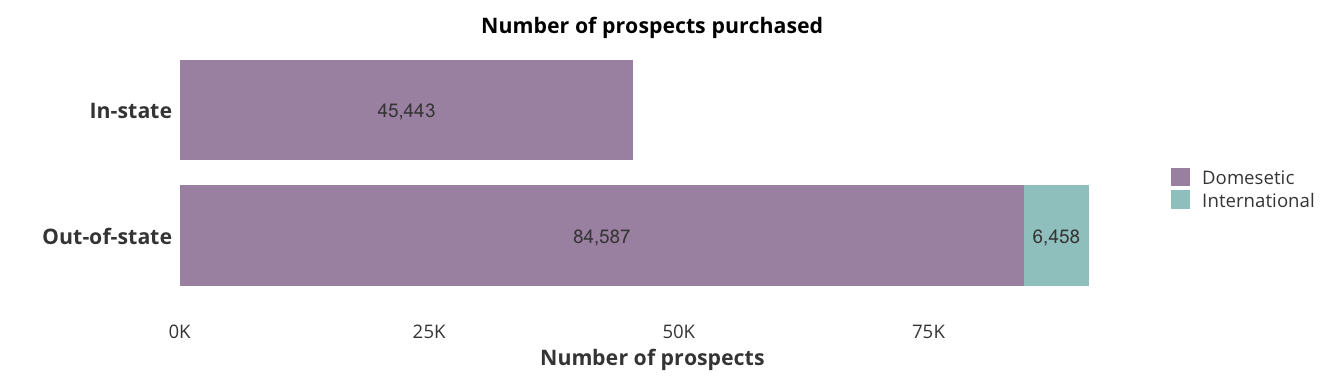
The University of Illinois at Urbana-Champaign made 34 list purchases in 2019. This included a total of 45K prospects purchased within the state of IL and 91K prospects purchased outside of IL, 6K of which are international students.
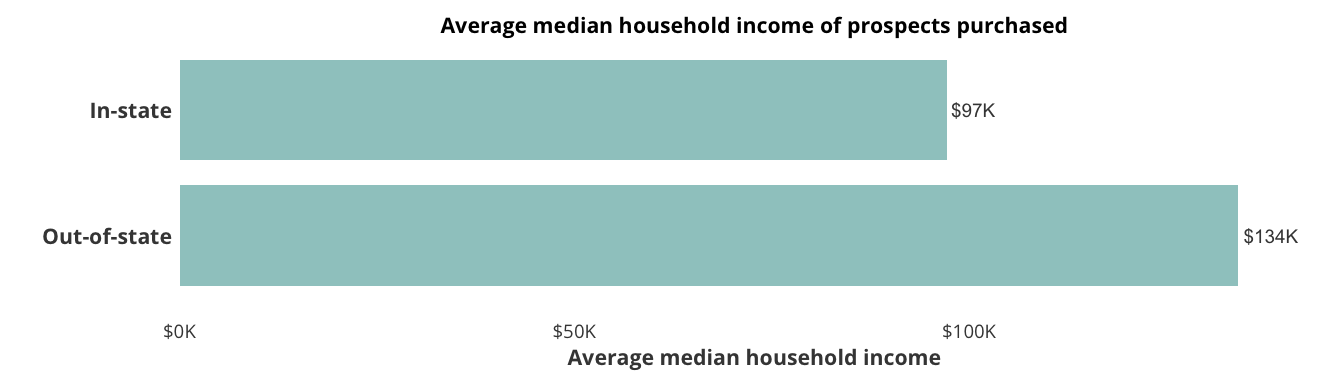
Prospects purchased from the state of Illinois reside in zip codes with an average median house income of $97,000. Prospects purchased from out-of-state reside in zip codes with higher median income, on average, at $134,000.
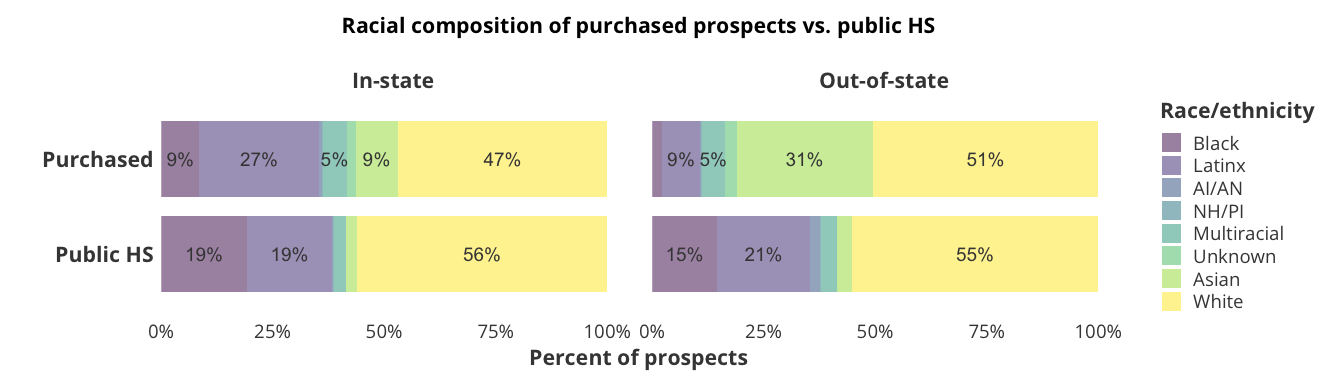
A lower proportion of purchased prospects tend to identify as Black as compared to the total proportion of Black students enrolled in public high schools. In contrast, a higher proportion of Latinx students and Asian students are purchased in the state of Illinois, and also Asian students out-of-state.
Footnote 1: Schools that satisfied the following criteria were included in the sample: offers and enrolls at least 10 students in grade 12; located in the 50 U.S. states, the District of Columbia, or land regulated by the Bureau of Indian Affairs; is not a virtual school; is an open status school and reports enrollment to the Federal Department of Education. Non-visited schools include only out-of-state schools in states that received at least one high school visit.
Footnote 2: Schools that satisfied the following criteria were included in the sample: offers and enrolls at least 10 students in grade 12; located in the 50 U.S. states, the District of Columbia, or land regulated by the Bureau of Indian Affairs; is not a virtual school; is an open status school and reports enrollment to the Federal Department of Education. Non-visited schools include only out-of-state schools in states that received at least one high school visit.
Footnote 3: Schools that satisfied the following criteria were included in the sample: offers and enrolls at least 10 students in grade 12; located in the 50 U.S. states, the District of Columbia, or land regulated by the Bureau of Indian Affairs. Non-visited schools include only out-of-state schools in states that received at least one high school visit.
Footnote 4: The university provided race data for each student using one or more of the following categories: American Indian or Alaska Native, Asian, Black or African American, Native Hawaiian or other Pacific Islander, White, or missing value. They also provided whether each student is of Hispanic origin by indicating: Yes, No, or missing value. To assign each student a single race/ethnicity category for the analysis, the following logic was used: Latinx if Hispanic origin indicator was a Yes; Multiracial if Hispanic origin indicator is not a Yes and more than one race categories were indicated; each respective race category if Hispanic origin indicator is not a Yes and only that one race category was indicated; No response otherwise.
In 2020, the University of Illinois at Urbana-Champaign required the submission of admission test scores like SAT and ACT. The 25th and 75th percentile SAT scores were 1200 and 1460, respectively, among applicants. The respective ACT scores were 27 and 33.
Students identifying as White make up the majority of enrolled full-time freshmen at 38.4%, followed by Asian then Latinx students. Black students make up 6.6% of full-time freshmen, and fewer than 0.1% identify as American Indian or Alaska Native and Native Hawaiian or Other Pacific Islander.
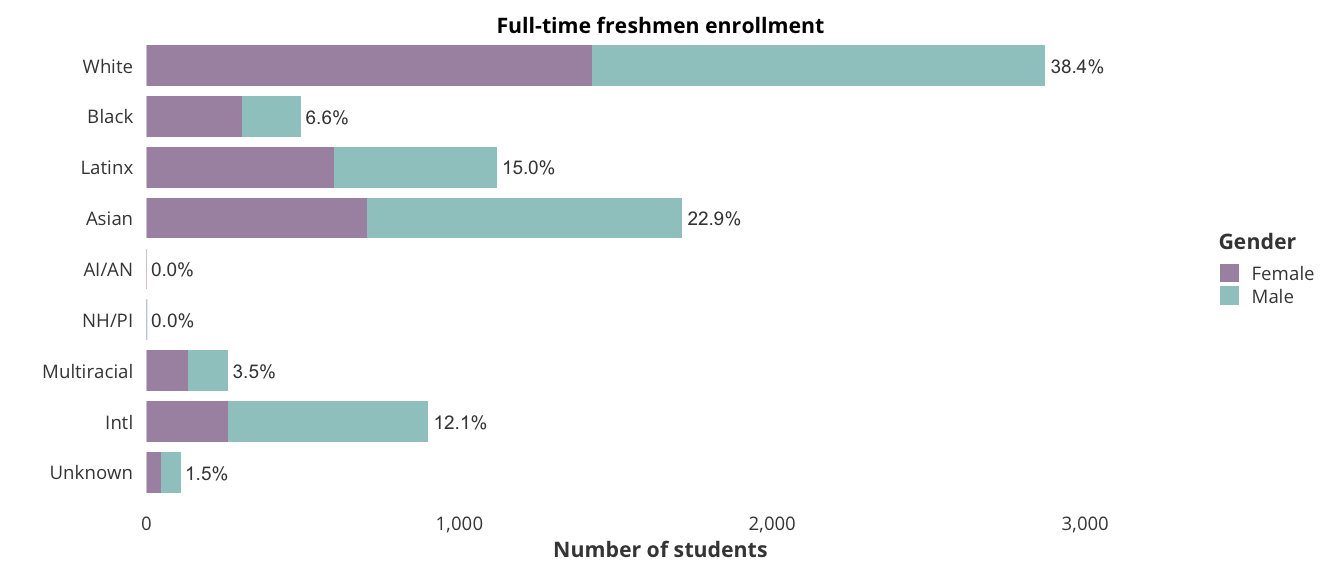
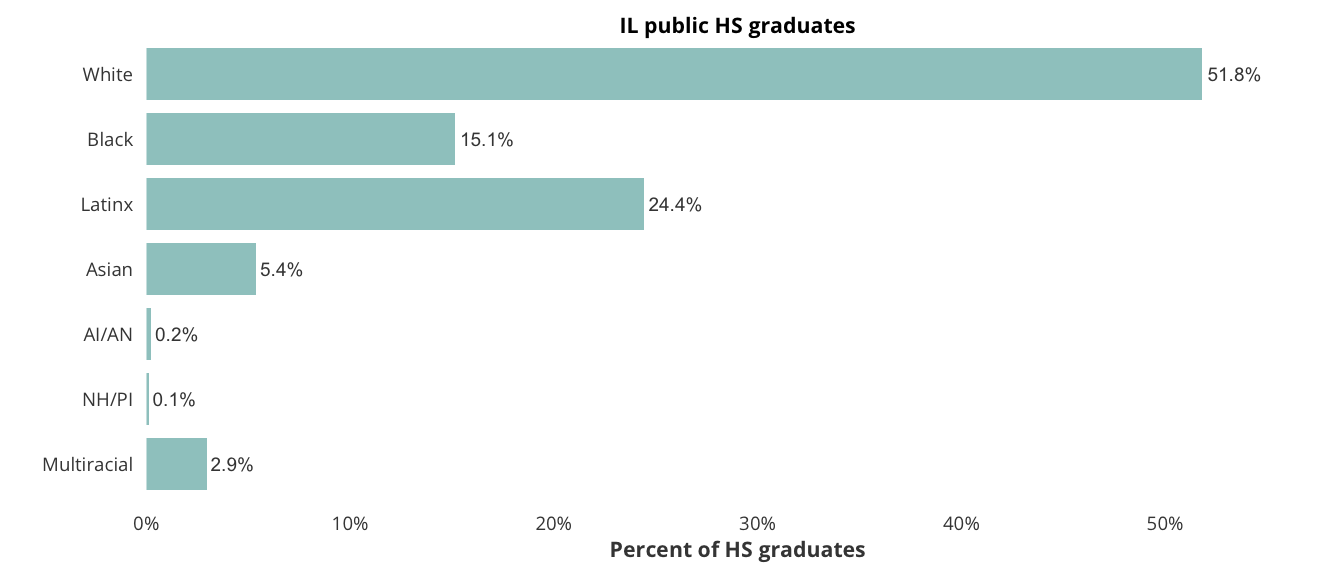
Students identifying as White make up the majority of public HS graduates in Illinois at 51.8%, followed by Latinx at 24.4%, and Black at 15.1%. However, the respective proportions of enrolled full-time freshmen and transfers are generally lower. On the other hand, Asian students are overrepresented in the enrolled population of students, as compared to the proportion of public HS graduates in the state.
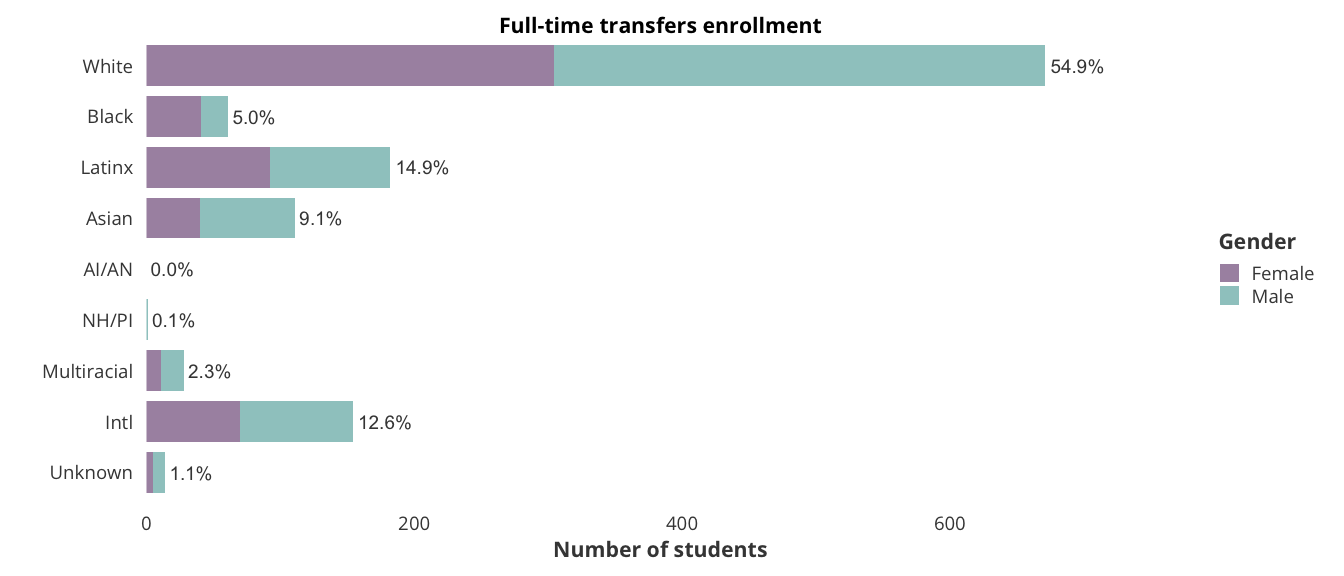
For full-time transfers, students identifying as White also make up the majority at 54.9%, followed by Latinx, international, then Asian students. Black students make up 5.0% of full-time transfers. Only 0.1% of students identify as Native Hawaiian or Other Pacific Islander, and there are no American Indian or Alaska Native full-time transfers.
Average grant aid is higher for low-income students than high-income students and, thus, the average net price paid increases as family income increases. For example, households earning less than $30,000 paid about $4,900 out-of-pocket, while households earning over $110,000 paid about $27,300.
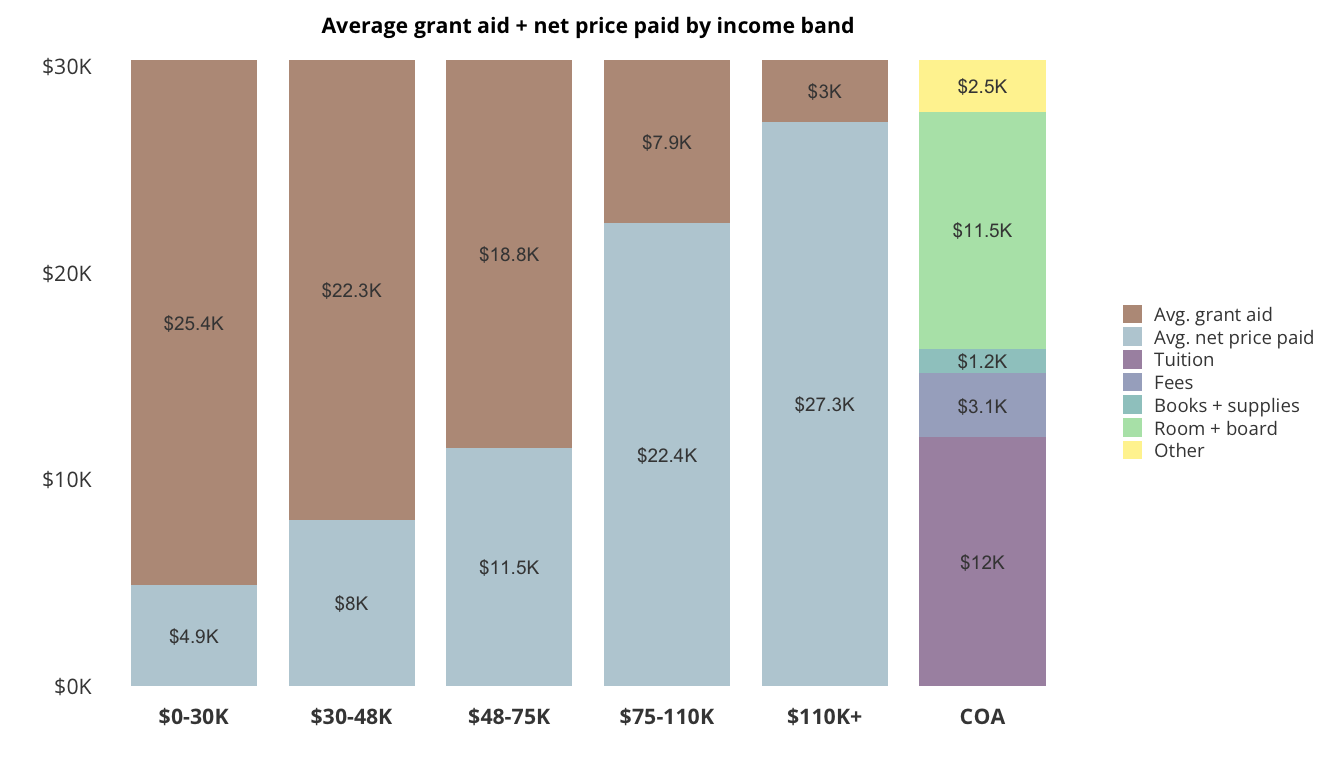
The University of Illinois at Urbana-Champaign is doing a good job supporting low-income students from households earning less than $30,000, providing an average of $25,400 in grant aid as compared to an average of $19,700 among all public AAU schools. The University is also doing better than the AAU average on supporting students from households earning between $30,000 and $75,000, although the burden on these families remains high.
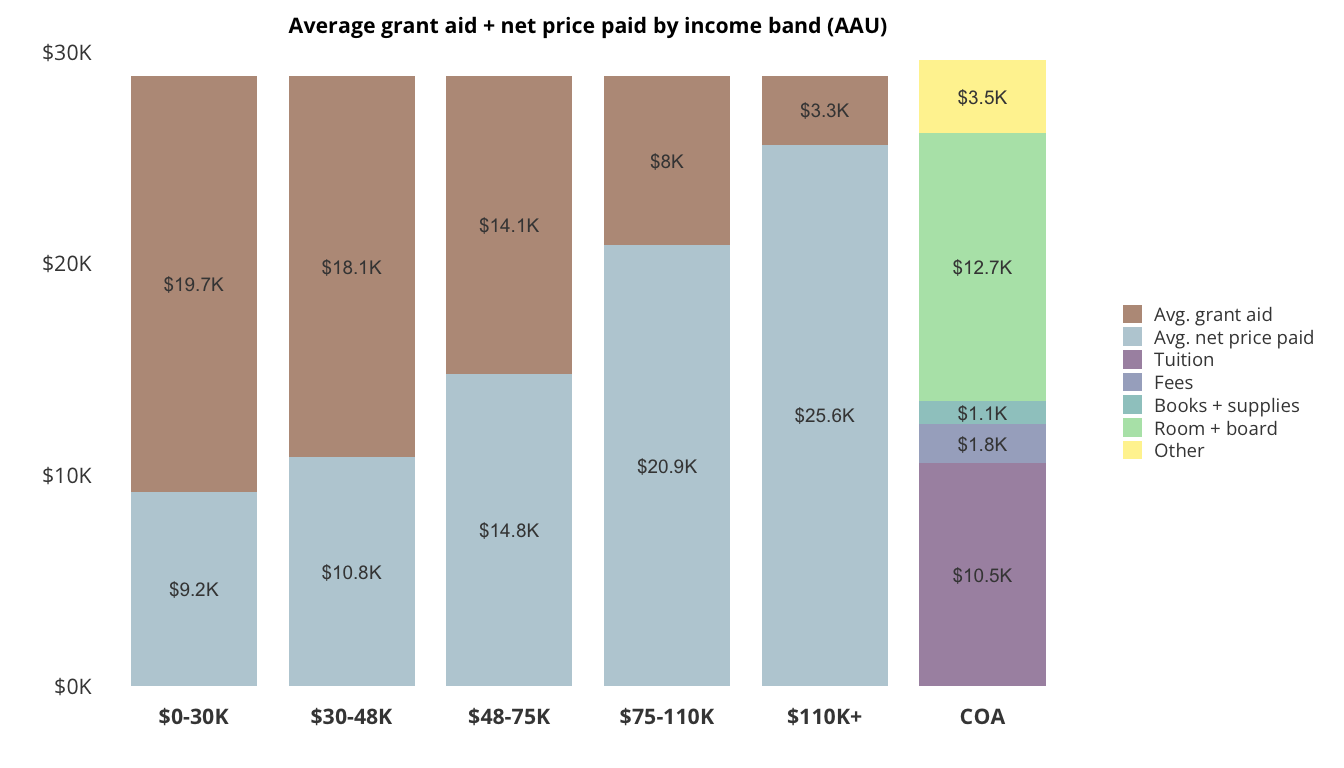
Footnote 1: Average grant aid is defined as the average amount of grant and scholarship aid from federal, state or local governments, or institutional sources awarded to full-time, first-time degree/certificate-seeking undergraduates paying the in-state or in-district tuition rate who were awarded title IV federal student aid. Title IV aid to students includes grant aid, work study aid, and loan aid. These include: Federal Pell Grant, Federal Supplemental Educational Opportunity Grant (FSEOG), Academic Competitiveness Grant (ACG), National Science and Mathematics Access to Retain Talent Grant (National SMART Grant), Teacher Education Assistance for College and Higher Education (TEACH) Grant, Federal Work-Study, Federal Perkins Loan, Subsidized Direct or FFEL Stafford Loan, and Unsubsidized Direct or FFEL Stafford Loan.
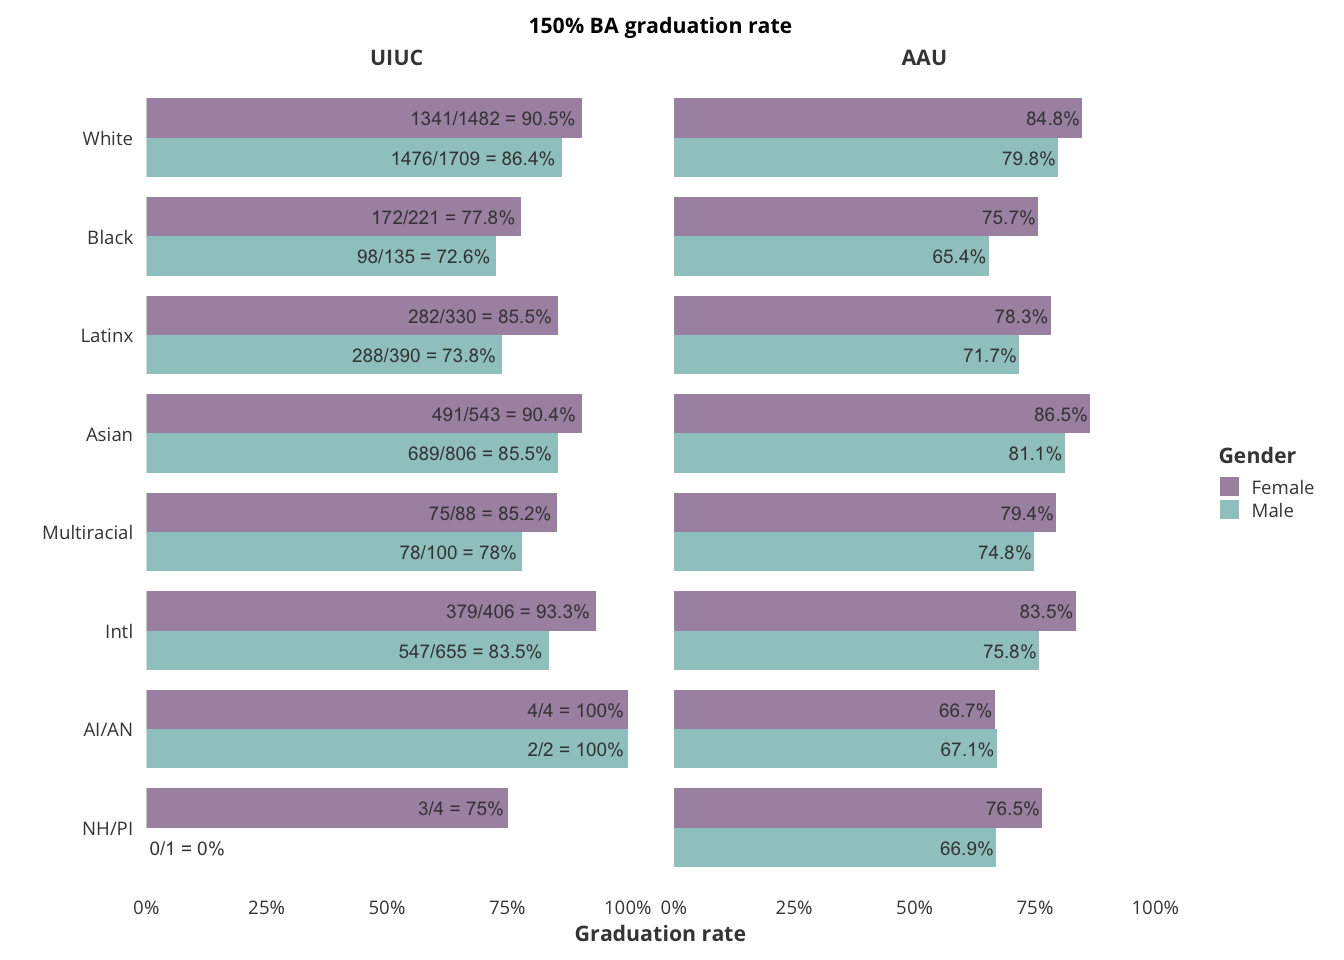
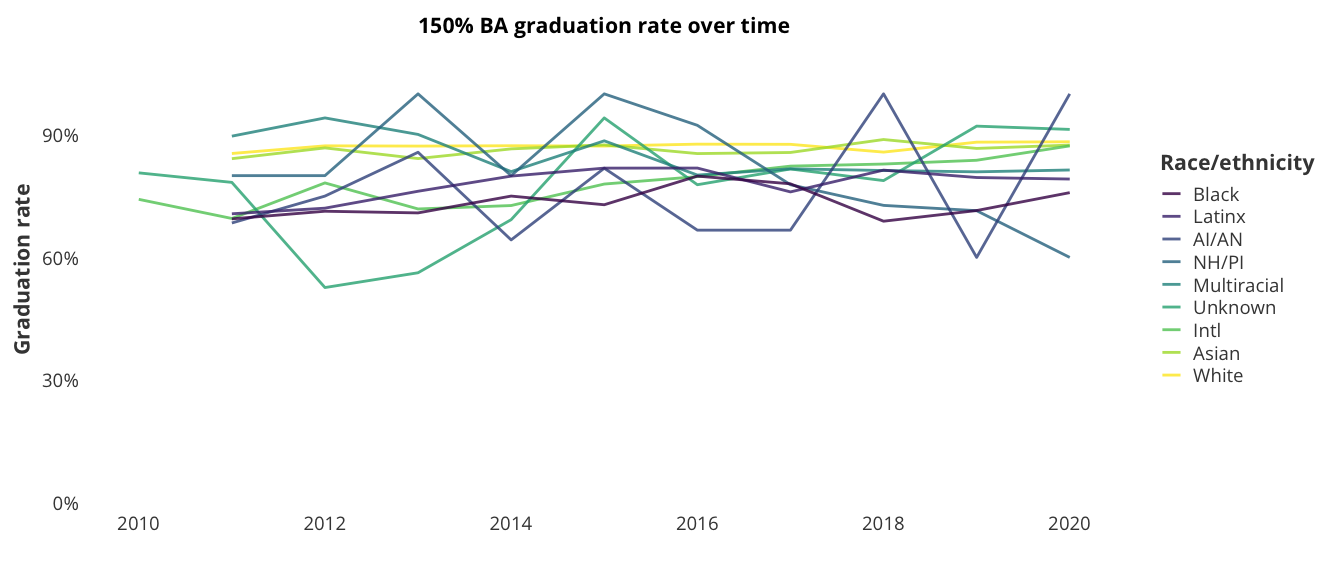
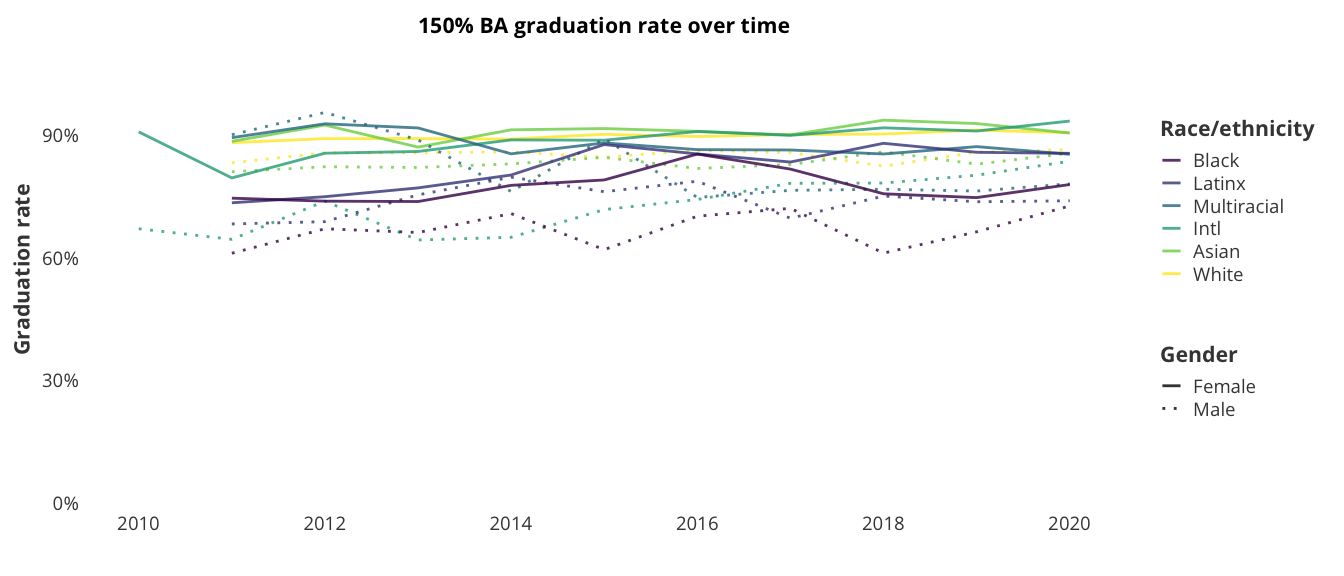
The 150% BA graduation rate is relatively consistent among race/ethnicity groups, with most being above 70%. The lowest graduation rates are among male Black and Latinx students. Female students generally have a higher graduation rate than male students across most race/ethnicity groups. UIUC also generally has higher graduation rates compared to the average public AAU school.
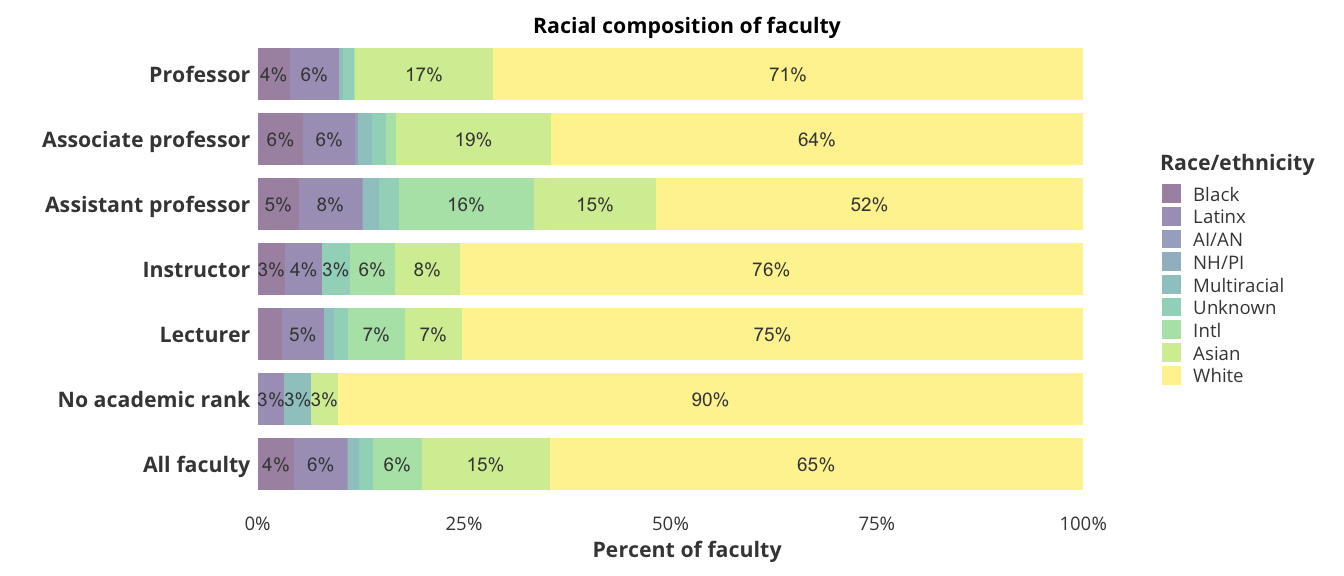
Generally, tenured faculty have the greatest level of influence due to their role in decision-making and senior-level administrative leadership, although non-tenure track faculty also make valuable contributions. As shown below, Black/African American faculty make up 4.4% of all faculty at UIUC in 2020, with greatest representation at the level of associate professor. While this percentage represents some growth in tenured Black faculty, a much-needed development, Black faculty continue to be underrepresented at the level of full professor, making up only 3.9% of full professors.
Further, it is concerning that Black faculty do not make up a higher percentage of assistant professors, meaning that the pool of faculty positioned for promotion into higher ranks (e.g., associate and full professor) is diminished. While White faculty are 51.7% of assistant professors, versus 71.5% of full professors, the group that has the next highest representation at the level of assistant professor is non-resident, international faculty.
Call to Action
While UIUC has made some strides in recent years to foster a more accessible, diverse, and inclusive campus community, it is clear there is still work to be done.
To learn more about the REASON Project and the Illinois REASON Coalition:
- Visit our webpage
- Read this Chicago Tribune article about the REASON Project
- Join the Illinois REASON Coalition email list
To learn more about racial equity efforts at UIUC:
- Inclusive Illinois Initiative: 2019-2020 Report
To learn more about Project 500:
About the REASON project
To address the enduring disconnect between the racial makeup of flagship universities and that of their home states, the Lawyers' Committee for Civil Rights Under Law launched The REASON Project, a multi-year effort to convene key stakeholders — civil rights, education, and advocacy organizations, policy experts, civil rights allies, alumni, and student-organizers — to create comprehensive strategies for increasing racial equity at The Ohio State University and the University of Illinois at Urbana-Champaign.